Report No. 04Optimizing Humanity's Outlook
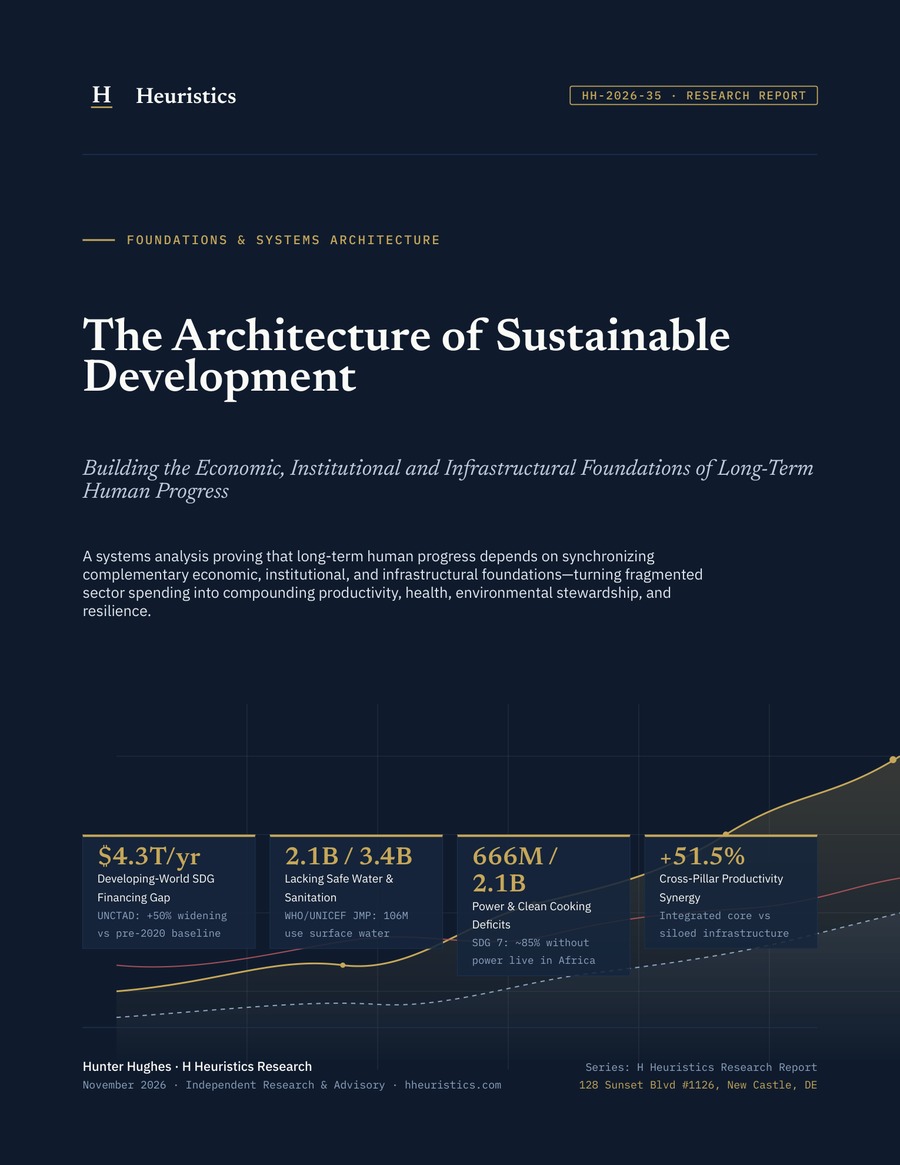
The Architecture of Sustainable Development
Building the Economic, Institutional and Infrastructural Foundations of Long-Term Human Progress
A systems analysis proving that long-term human progress depends on synchronizing complementary economic, institutional, and infrastructural foundations—turning fragmented sector spending into compounding productivity, health, environmental stewardship, and resilience.
By Hunter Hughes
- Published
- Length
- 30 pages
- Report ID
- HH-2026-35
- Licence
- CC BY 4.0
Full text
Trouble viewing? Open the PDF in a new tab.
Abstract
The Architecture of Sustainable Development examines the interconnected economic, institutional, technological, and infrastructural foundations required to sustain long-term human progress across the twenty-first century. Although global poverty reduction and income expansion have advanced over recent decades, foundational structural deficits remain severe across emerging and developing economies, where UNCTAD places the annual Sustainable Development Goals (SDG) investment gap at roughly $4.3 trillion—more than 50% wider than pre-pandemic baselines—while 2.1 billion people lack safely managed drinking water, 3.4 billion lack safely managed sanitation, 666 million remain without electricity (~85% in Sub-Saharan Africa), and 2.1 billion rely on polluting cooking fuels.
Employing a cross-system complementarity framework across 184 economies (H Heuristics Architecture Model v3.5), the report demonstrates why isolated single-ministry investments frequently stall in isolation yet generate a +51.5% composite productivity dividend when clean energy, piped water, all-season rural transport corridors, open digital infrastructure, structured schooling, and public investment governance are co-deployed. Combining solar-plus-storage mini-grids anchored to productive agricultural and clinical loads, Dig-Once road-and-fiber standards, utility non-revenue-water reforms, and IMF Public Investment Management Assessment (PIMA) procurement rules cuts capital cost overruns from 38% to 11% while doubling downstream economic and human-capability returns.
Across three structured 2026–2050 trajectories starting from a global developing readiness baseline of 38.4 on the Composite Development Architecture Index, siloed debt-constrained persistence lifts readiness modestly to 45.4 by 2050, gradual reform reaches 66.2, and coordinated architectural execution accelerates convergence to 89.2. On the coordinated pathway—pairing multilateral FX risk mitigation, domestic e-tax widening, and climate-resilient debt clauses with physical and human systems integration—global access by 2050 climbs to 96.5% safely managed water, 98.5% clean power reliability, 95.0% clean cooking, 96.0% broadband and DPI coverage, and 86.5% foundational youth learning proficiency. Projections represent scenario pathways conditional on institutional execution rather than unconditional forecasts.
Key findings
- 1
UNCTAD assessments place the annual developing-world SDG investment gap near $4.3 trillion (+50% wider than pre-2020 baselines), led by clean energy and grids ($1,380B), transport and transit corridors ($920B), education and primary healthcare ($740B), WASH systems ($510B), digital fiber and 5G networks ($420B), and climate resilience ($330B).
- 2
Cross-system complementarity decomposes a +51.5% total worker-output synergy (from a 100.0 siloed baseline to 151.5) when reliable grid power (+11.4 points), clean water and disease relief (+8.6), all-season transport (+9.8), digital rails (+8.2), human skills (+7.4), and institutional governance (+6.1) are synchronized rather than pursued piecemeal.
- 3
WHO/UNICEF JMP and IEA/World Bank Tracking SDG 7 baselines reveal persistent foundational deprivations—2.1B lacking safely managed drinking water, 3.4B lacking safe sanitation, 666M without electricity (~566M in Sub-Saharan Africa), and 2.1B without clean cooking—with fragile contexts lagging non-fragile peers by 38 percentage points on basic WASH access.
- 4
Co-deploying physical and digital arteries ('Dig-Once' fiber conduits, all-season roads, and solar-powered cold chains) reduces rural broadband deployment capital costs by 35%–50% and compresses post-harvest agricultural spoilage from ~32% toward 7.2% by 2040, while synchronized WASH, nutrition, clean cooking, and school electrification lift long-run adult wage and schooling returns to +34.5% versus +11.2% for classroom construction alone.
- 5
Public institutions act as the fiscal operating system of physical capital: top-tier IMF PIMA performers hold capital cost overruns near 11% versus 38% in weak-governance regimes, while sovereign debt servicing consumes 24.5% of fiscal revenue across debt-stressed low-income countries (leaving only 6.4% for health vs. 19.8% in high-income peers).
- 6
In H Heuristics Architecture Model (v3.5) 2026–2050 simulations, the global Composite Development Architecture Index rises from 38.4 in 2026 to 45.4 under siloed stagnation, 66.2 under gradual reform, and 89.2 under coordinated execution—reaching 96.5% safe water, 98.5% clean power, 95.0% clean cooking, 96.0% DPI/broadband, and 86.5% youth reading/math proficiency by 2050.
Contents
- ·Executive Summary & Core Thesis
- 01Systems Complementarity: Why Economic, Institutional & Infrastructural Pillars Reinforce One Another
- 02Universal Clean Water, Sanitation & Environmental Health Infrastructure
- 03Energy Access, Clean Cooking & Resilient Grid Modernization
- 04Transportation Networks, Digital Connectivity & Spatial Integration
- 05Education, Primary Healthcare & Shock-Responsive Social Foundations
- 06Effective Institutions, Public Investment Governance & State Capacity
- 07Closing the $4.3T Financing Gap: Sovereign Debt, Tax & Blended Capital
- 08Integrated 2026–2050 Delivery Architecture & Operational Playbook
- ·Methodological Appendix: Cross-System Accounting & Data Notes
- ·References & Primary Sources
Data and method
An integrated cross-system empirical and scenario synthesis grounded in WHO/UNICEF Joint Monitoring Programme (JMP) household water and sanitation panels (2000–2024), IEA/World Bank/WHO Tracking SDG 7 energy assessments (2025), UNCTAD SDG investment gap and World of Debt fiscal panels (2024–2025), IMF Public Investment Management Assessment (PIMA) cost-overrun audits, World Bank IBNET municipal utility benchmarks, ITU connectivity indicators, FAO post-harvest cold-chain series, WHO Universal Health Coverage indices, and UNESCO/World Bank Human Capital and learning-poverty datasets. Cross-pillar elasticities follow a nested constant-elasticity-of-substitution (CES) complementarity specification (sigma ~ 0.45) calibrated across 184 economies in the H Heuristics Sustainable Development Architecture Model (v3.5). Projections to 2040 and 2050 reflect conditional policy scenarios rather than forecasts. The monograph comprises an executive summary, eight analytical chapters, 16 data figures, and a technical methodological appendix.
Report record
- Series number
- No. 04
- Report ID
- HH-2026-35
- Published
- Author
- Hunter Hughes
- Publisher
- H Heuristics
- Pages
- 30
- Format
- PDF, 1.1 MB
- Language
- English
- Licence
- CC BY 4.0
- Keywords
- sustainable development architecture
- institutional capacity
- infrastructure complementarity
- clean water and sanitation
- energy access
- digital connectivity
- human capital systems
- SDG financing gap
Cite this report
Hughes, H. (2026). The Architecture of Sustainable Development (H Heuristics Research Report No. HH-2026-35). H Heuristics. https://doi.org/10.5281/zenodo.24225938Hughes, Hunter. "The Architecture of Sustainable Development." H Heuristics Research Report HH-2026-35. H Heuristics, 2026. https://doi.org/10.5281/zenodo.24225938.@techreport{hughes2026architecture,
title = {The Architecture of Sustainable Development},
author = {Hunter Hughes},
institution = {H Heuristics},
type = {H Heuristics Research Report},
number = {HH-2026-35},
year = {2026},
month = {nov},
doi = {10.5281/zenodo.24225938},
url = {https://globaloutlook.hheuristics.com/reports/architecture-of-sustainable-development/}
}Read the full report
PDF · 30 pages · 1.1 MB · CC BY 4.0 · free to read and share