Report No. 01Optimizing Humanity's Outlook
The Economics of Global Convergence
Accelerating Productivity, Income Growth and Development Across Emerging Economies (2026–2100)
A synthesis of theory, data and scenarios arguing that global economic convergence can be treated as an achievable development objective, advanced through technology diffusion, human capital, modern infrastructure, economic complexity and institutional reform.
By Hunter Hughes
- Published
- Length
- 30 pages
- Report ID
- HH-2026-32
- Licence
- CC BY 4.0
Full text
Trouble viewing? Open the PDF in a new tab.
Abstract
This report examines how emerging and developing economies could shorten catch-up timelines over the rest of the twenty-first century. Its central argument is that global economic convergence should be treated not as a slow statistical tendency but as an achievable development objective. It proposes five reinforcing pillars: wider access to productive technologies and digital infrastructure; stronger foundational human capital and absorptive capacity; closing deficits in energy, transport and urban infrastructure; greater economic complexity through upgrading in manufacturing and tradable services; and better institutional quality, macroeconomic stability and cross-border integration.
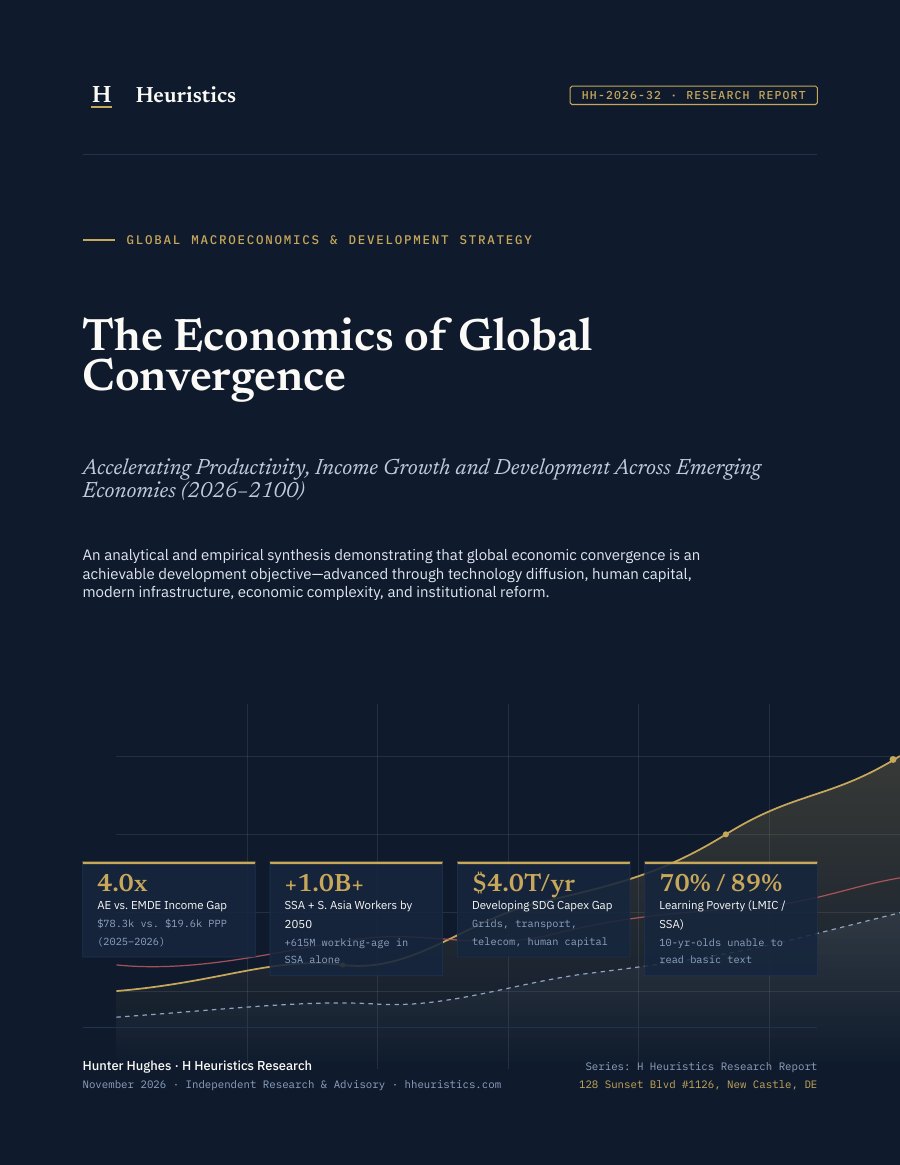
Average output per person in emerging and developing economies is about $19,600 at purchasing power parity, against about $78,300 in advanced economies, a gap of roughly four times. After decades of divergence, poorer economies on average grew faster than rich ones after 2000, as schooling, macroeconomic stability and trade integration converged. United Nations projections put more than one billion additional working-age people in Sub-Saharan Africa and South Asia by 2050, and Sub-Saharan Africa at about one third of humanity by 2100. The report identifies the constraints that decide whether this becomes growth: 70% of ten-year-olds in low- and middle-income countries cannot read a basic text (89% in Sub-Saharan Africa), internet use is 94% in high-income countries against 23% in low-income countries, and developing countries face an investment gap of about $4.0 trillion a year.
The report models three scenarios to 2100 for income per person in the Global South relative to the advanced-economy frontier, starting from 25.2% in 2026: 34.5% under fragmented stagnation, 65.4% under gradual baseline catch-up, and 88.9% under accelerated coordinated convergence. In the accelerated scenario, total Global South output reaches about $740 trillion by 2100, against $310 trillion on the fragmented path. It closes with early milestones for 2026–2035 and a ten-point playbook. The projections are scenario modelling under stated assumptions, not forecasts.
Key findings
- 1
Convergence responds to policy. After divergence before 1990, poorer economies on average grew faster than rich ones after 2000, as education, macroeconomic stability and infrastructure converged across fast-reforming economies. East Asia tripled its share of frontier income after 1990, while Sub-Saharan Africa slipped back in relative terms.
- 2
The century's workforce is moving to the Global South. More than 615 million new working-age people in Sub-Saharan Africa and about 395 million in South Asia are projected by 2050, and Sub-Saharan Africa approaches one third of humanity by 2100. The report treats this as a window, not an automatic dividend: it pays off only if jobs, urban infrastructure and foundational skills scale ahead of the labour force.
- 3
Digital infrastructure and AI can speed catch-up only if access gaps close. Internet use stands at 94% in high-income countries, 34% in the least developed countries and 23% in low-income countries.
- 4
Foundational learning and infrastructure are the binding constraints. Learning poverty is 70% across low- and middle-income countries and 89% in Sub-Saharan Africa, and investment needs run at $4.0–4.3 trillion a year through 2030, while low-income countries spend more than 24% of public revenue on debt service. The report estimates that halving learning poverty and raising Human Capital Index scores towards 0.65 would add nearly 1.7 percentage points to annual labour productivity growth in lagging economies.
- 5
In the report's accelerated scenario, income per person in the Global South rises from 25.2% of the advanced-economy frontier in 2026 to 88.9% by 2100, against 65.4% in the baseline and 34.5% under fragmented stagnation. Total Global South output in 2100 is about $740 trillion in the accelerated scenario and $310 trillion in the fragmented one.
- 6
The report treats 2026–2035 as the decisive decade and sets out five early indicators for 2035: learning poverty below 35%, fixed investment at 28–33% of GDP, digital coverage above 80%, a blended cost of capital under 7.5% with grid reliability above 98%, and a rising share of medium-technology and tradable-service exports.
Contents
- ·Executive Summary & Core Thesis
- 01The New Arithmetic of Catch-Up: Theory & the Post-1990 Reversal
- 02Demographic Gravity: The Global South's Century-Scale Labor Window
- 03Productive Technology Diffusion, Digital Public Rails & AI Readiness
- 04Human Capital, Foundational Learning & Absorptive Capacity
- 05Infrastructure Bottlenecks, Industrialization & Economic Complexity
- 06Global Integration, Value Chains & Development Finance Architecture
- 07Institutional Capacity, Inequality & Interconnected Global Risks
- 08Century-Scale Scenarios (2026–2100) & The H Heuristics Playbook
- ·Methodological Appendix: Growth Accounting, Equations & Data Notes
- ·References & Primary Sources
Data and method
An analytical and empirical synthesis. The quantitative series draw on the IMF World Economic Outlook and Penn World Table 10.01 for income at purchasing power parity, UN World Population Prospects 2024 (medium variant), World Bank and UNESCO Learning Poverty and Human Capital Index data, ITU Facts and Figures 2024–2025, UNCTAD and IHLEG financing assessments, and the Harvard Atlas of Economic Complexity. Convergence is framed with an extended Barro–Mankiw–Romer–Weil specification, following Kremer, Willis and You (2022), and productivity growth is decomposed with a Cobb–Douglas growth-accounting identity using a capital share of 0.36. The three scenarios to 2100 come from the H Heuristics Century-Scale Convergence Model, with catch-up speeds of about 0.6%, 1.4% and 2.3–2.8% a year against a frontier growing at 1.35–1.55% a year. The report grades its claims on a four-level scale from established to scenario or speculative, and it states that the century-scale projections are structural scenario benchmarks conditioned on institutional choices, not deterministic forecasts. It contains 16 figures across eight numbered sections and a methodological appendix.
Report record
- Series number
- No. 01
- Report ID
- HH-2026-32
- Published
- Author
- Hunter Hughes
- Publisher
- H Heuristics
- Pages
- 30
- Format
- PDF, 1.1 MB
- Language
- English
- Licence
- CC BY 4.0
- Keywords
- global economic convergence
- productive capabilities
- demographic dividend
- human capital
- technology diffusion
- economic complexity
- infrastructure finance
- institutional capacity
Cite this report
Hughes, H. (2026). The Economics of Global Convergence (H Heuristics Research Report No. HH-2026-32). H Heuristics. https://doi.org/10.5281/zenodo.24224458Hughes, Hunter. "The Economics of Global Convergence." H Heuristics Research Report HH-2026-32. H Heuristics, 2026. https://doi.org/10.5281/zenodo.24224458.@techreport{hughes2026economics,
title = {The Economics of Global Convergence},
author = {Hunter Hughes},
institution = {H Heuristics},
type = {H Heuristics Research Report},
number = {HH-2026-32},
year = {2026},
month = {nov},
doi = {10.5281/zenodo.24224458},
url = {https://globaloutlook.hheuristics.com/reports/economics-of-global-convergence/}
}Read the full report
PDF · 30 pages · 1.1 MB · CC BY 4.0 · free to read and share